Why no sensor tells the truth, how the Gaussian describes its noise, and how to fuse two noisy readings into one better estimate. 6 short slides, then worked examples and problems. Each slide has an everyday picture, a worked example and Python you can run right on the page.
 Lesson 1The Kalman filterWhat the Kalman filter does: truth plus noiseOpen slide →01 · Lesson 1 · What is the Kalman filter?
The Kalman filter in plain words: every sensor reads truth plus noise, and the filter fuses them by predicting and correcting. With Python you can run.
 Lesson 1Random variablesRandom variables: mean, variance and standard deviationOpen slide →02 · Lesson 1 · Random variables
Why a sensor reading is a random variable, and how to measure its noise with the mean, variance and standard deviation, by hand and in Python.
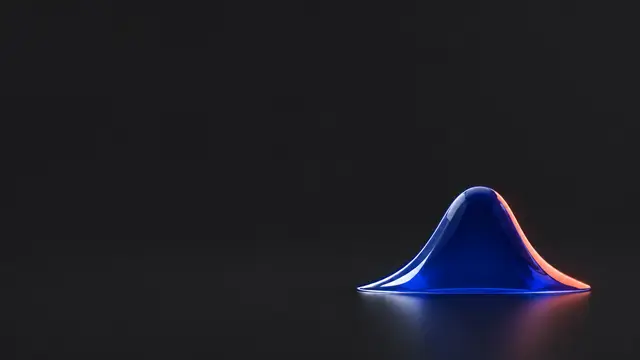 Lesson 1The GaussianThe Gaussian bell curve and the 68-95 ruleOpen slide →03 · Lesson 1 · The Gaussian
The bell curve in plain words: mean and variance, the 68-95 rule, and why adding or scaling Gaussians is so easy. Worked examples and live Python.
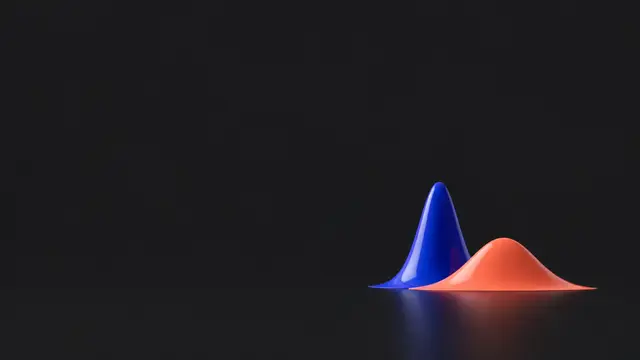 Lesson 1Sensor qualityVariance as sensor quality: which sensor to trustOpen slide →04 · Lesson 1 · Variance and sensor quality
A sensor's noise variance tells you how much to trust it. Two sensors centred on the truth, the 68-95 rule, averaging, and Python to compare them.
 Lesson 1Data fusionData fusion: combining two sensors with the gain KOpen slide →05 · Lesson 1 · Data fusion
Fuse two noisy sensors with a weighted average, the gain K and the fused variance. Two thermometers, worked examples and Python you can run.
 Lesson 1RecapLesson 1 recap: noise, the bell curve and data fusionOpen slide →06 · Recap · Reading
Lesson 1 in one page: truth plus noise, mean and variance, the Gaussian and its 68-95 rule, variance as sensor quality, and the fusion rule with gain K.